Introducing UniDoc PDF Debugger: See Inside Any PDF



Most of the time a PDF is just something you open and read. Every so often, though, you need to know how one is actually put together rather than how it looks on the page. Maybe you’re checking that the file your code just produced has the structure you intended. Maybe you’re pulling apart a document someone sent you to see what it’s really made of, or tracking down why a specific object is malformed, or confirming what a file declares about its fonts, its metadata, or its signatures. Whatever the reason, the question is the same: what is actually in this file?
A regular PDF viewer can’t answer that, because a PDF isn’t really a page. It’s a container full of objects that reference each other, and the page you see is just what you get after those objects are rendered. The viewer shows you the result and hides the parts. To inspect a document, you need to get at the objects directly: the tree they form, the streams they hold, the references between them.
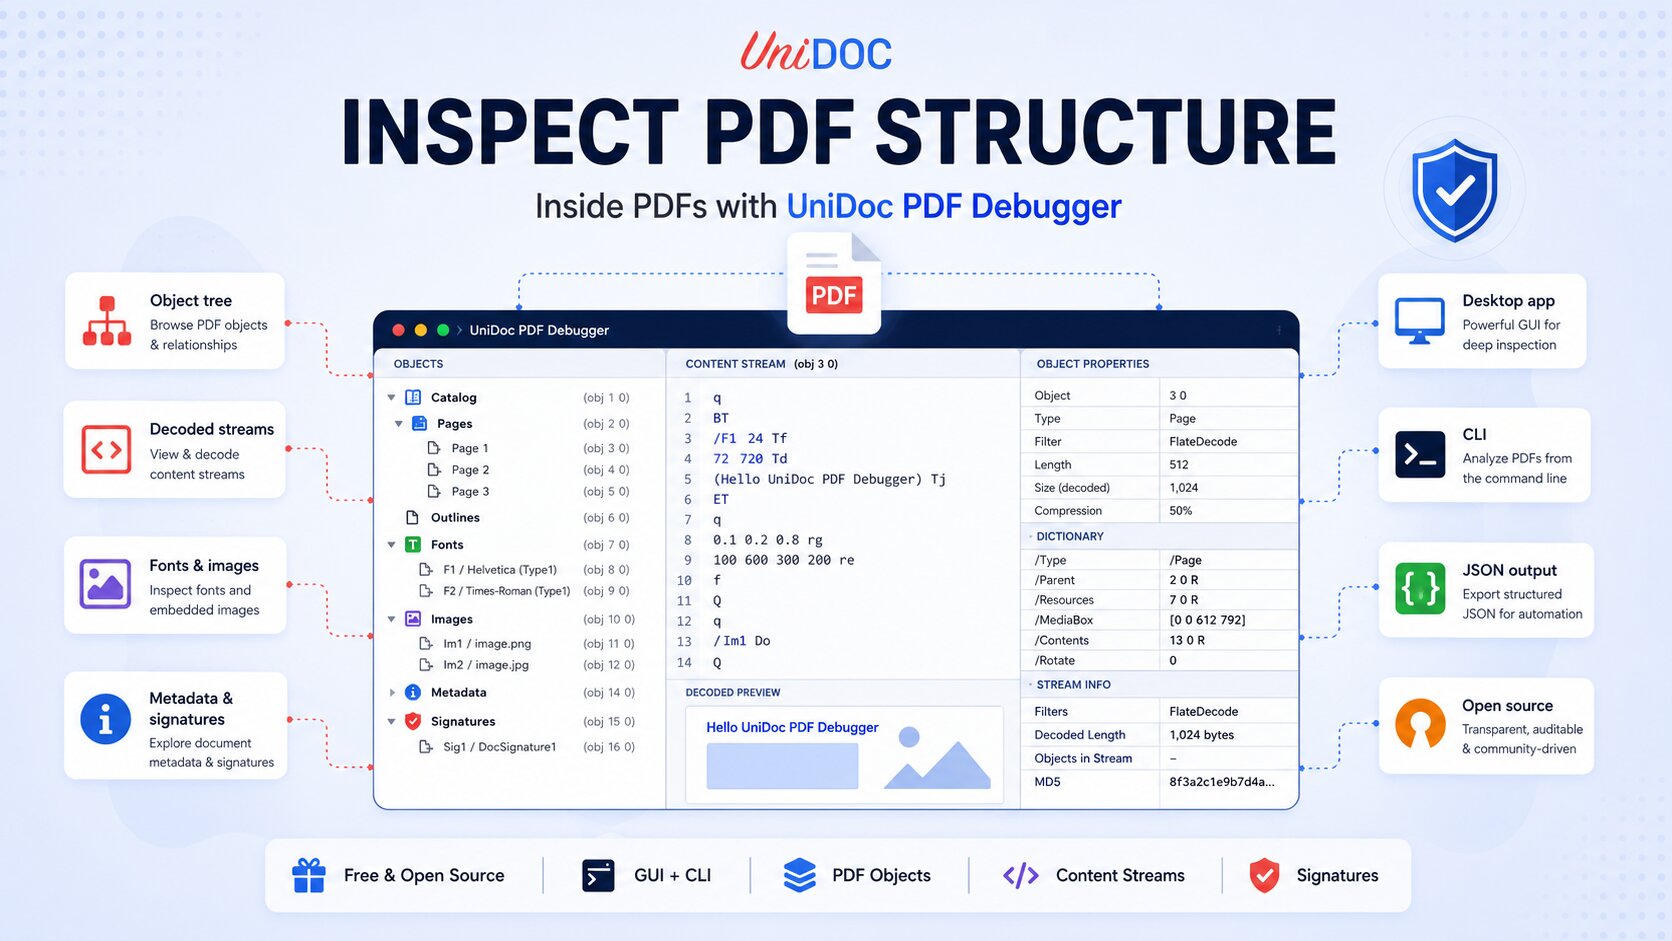
UniDoc PDF Debugger is a free, open-source tool that shows you the objects instead of the page. Open any PDF and you get its internal structure laid out directly: the object tree, the content streams, the fonts and images, the cross-reference table, embedded files, metadata, digital signatures. It reads the file as it exists on disk and shows you what’s there, no rendering, no hiding.
There are two ways to use it, both built on the same engine:
- A native desktop app for macOS, Windows, and Linux, for when you want to click around and explore.
- A command-line tool,
pdfdebug, for when you want to script something, run it in CI, or pipe structured output into another tool.
What you can look at
The desktop app and the CLI answer the same question from different angles: what is actually in this file?
The object tree is the heart of it. It’s the full graph of the document, and it expands lazily, so a huge file doesn’t grind everything to a halt when you open it. Click any node and you see the raw dictionary, array, or stream behind it.
Because it’s a graph, getting around matters as much as reading any single object. References are clickable, so following a pointer to the object it names takes one click, and a “referenced by” view runs that in reverse to show you everything pointing at the object you’re on, which is how you find orphans or track down who owns a resource. A command palette (Cmd+K) jumps straight to any object by number when you already know where you’re headed, there’s a go-to-page shortcut for working page by page, and you can keep several documents open in tabs when you’re comparing notes between files.
From there, most of the interesting views hang off individual objects:
- Content streams get decoded and syntax-highlighted, and every one of the roughly seventy PDF operators has a plain-language tooltip. You no longer have to remember what
BT /F1 12 Tfmeans off the top of your head. - Images are pulled straight out of the object graph and shown inline, including the CMYK and JPEG cases that usually trip other tools up.
- Fonts come with their encoding tables and glyph-to-Unicode mappings, plus a health summary that points at the things that tend to make text unsearchable or uncopyable.
- Document-level structures each get a view of their own: the cross-reference table, embedded files you can pull out and save to disk, the document metadata and its XMP block, and digital signatures broken down into their pieces. These are the parts almost no viewer bothers to surface.
The signature view deserves a note, because it’s careful about what it says. It decomposes what’s actually in the file, the certificate chain, the signing details, and how much of the document the signature covers, but it never tells you a signature is valid or trusted. That’s a claim only a real cryptographic verifier should make, and pretending otherwise would be worse than saying nothing. The same restraint runs through the whole tool: it shows you what’s there and lets you draw the conclusion.
There’s also a structural validation pass for PDF/A and PDF/UA. It’s deliberately modest about what it claims: it flags what looks wrong and points you at the object responsible, but it doesn’t pretend to be a full conformance verdict. If you need that, a dedicated validator is still the right call. For catching the obvious structural problems early, this is usually enough.
A quick look
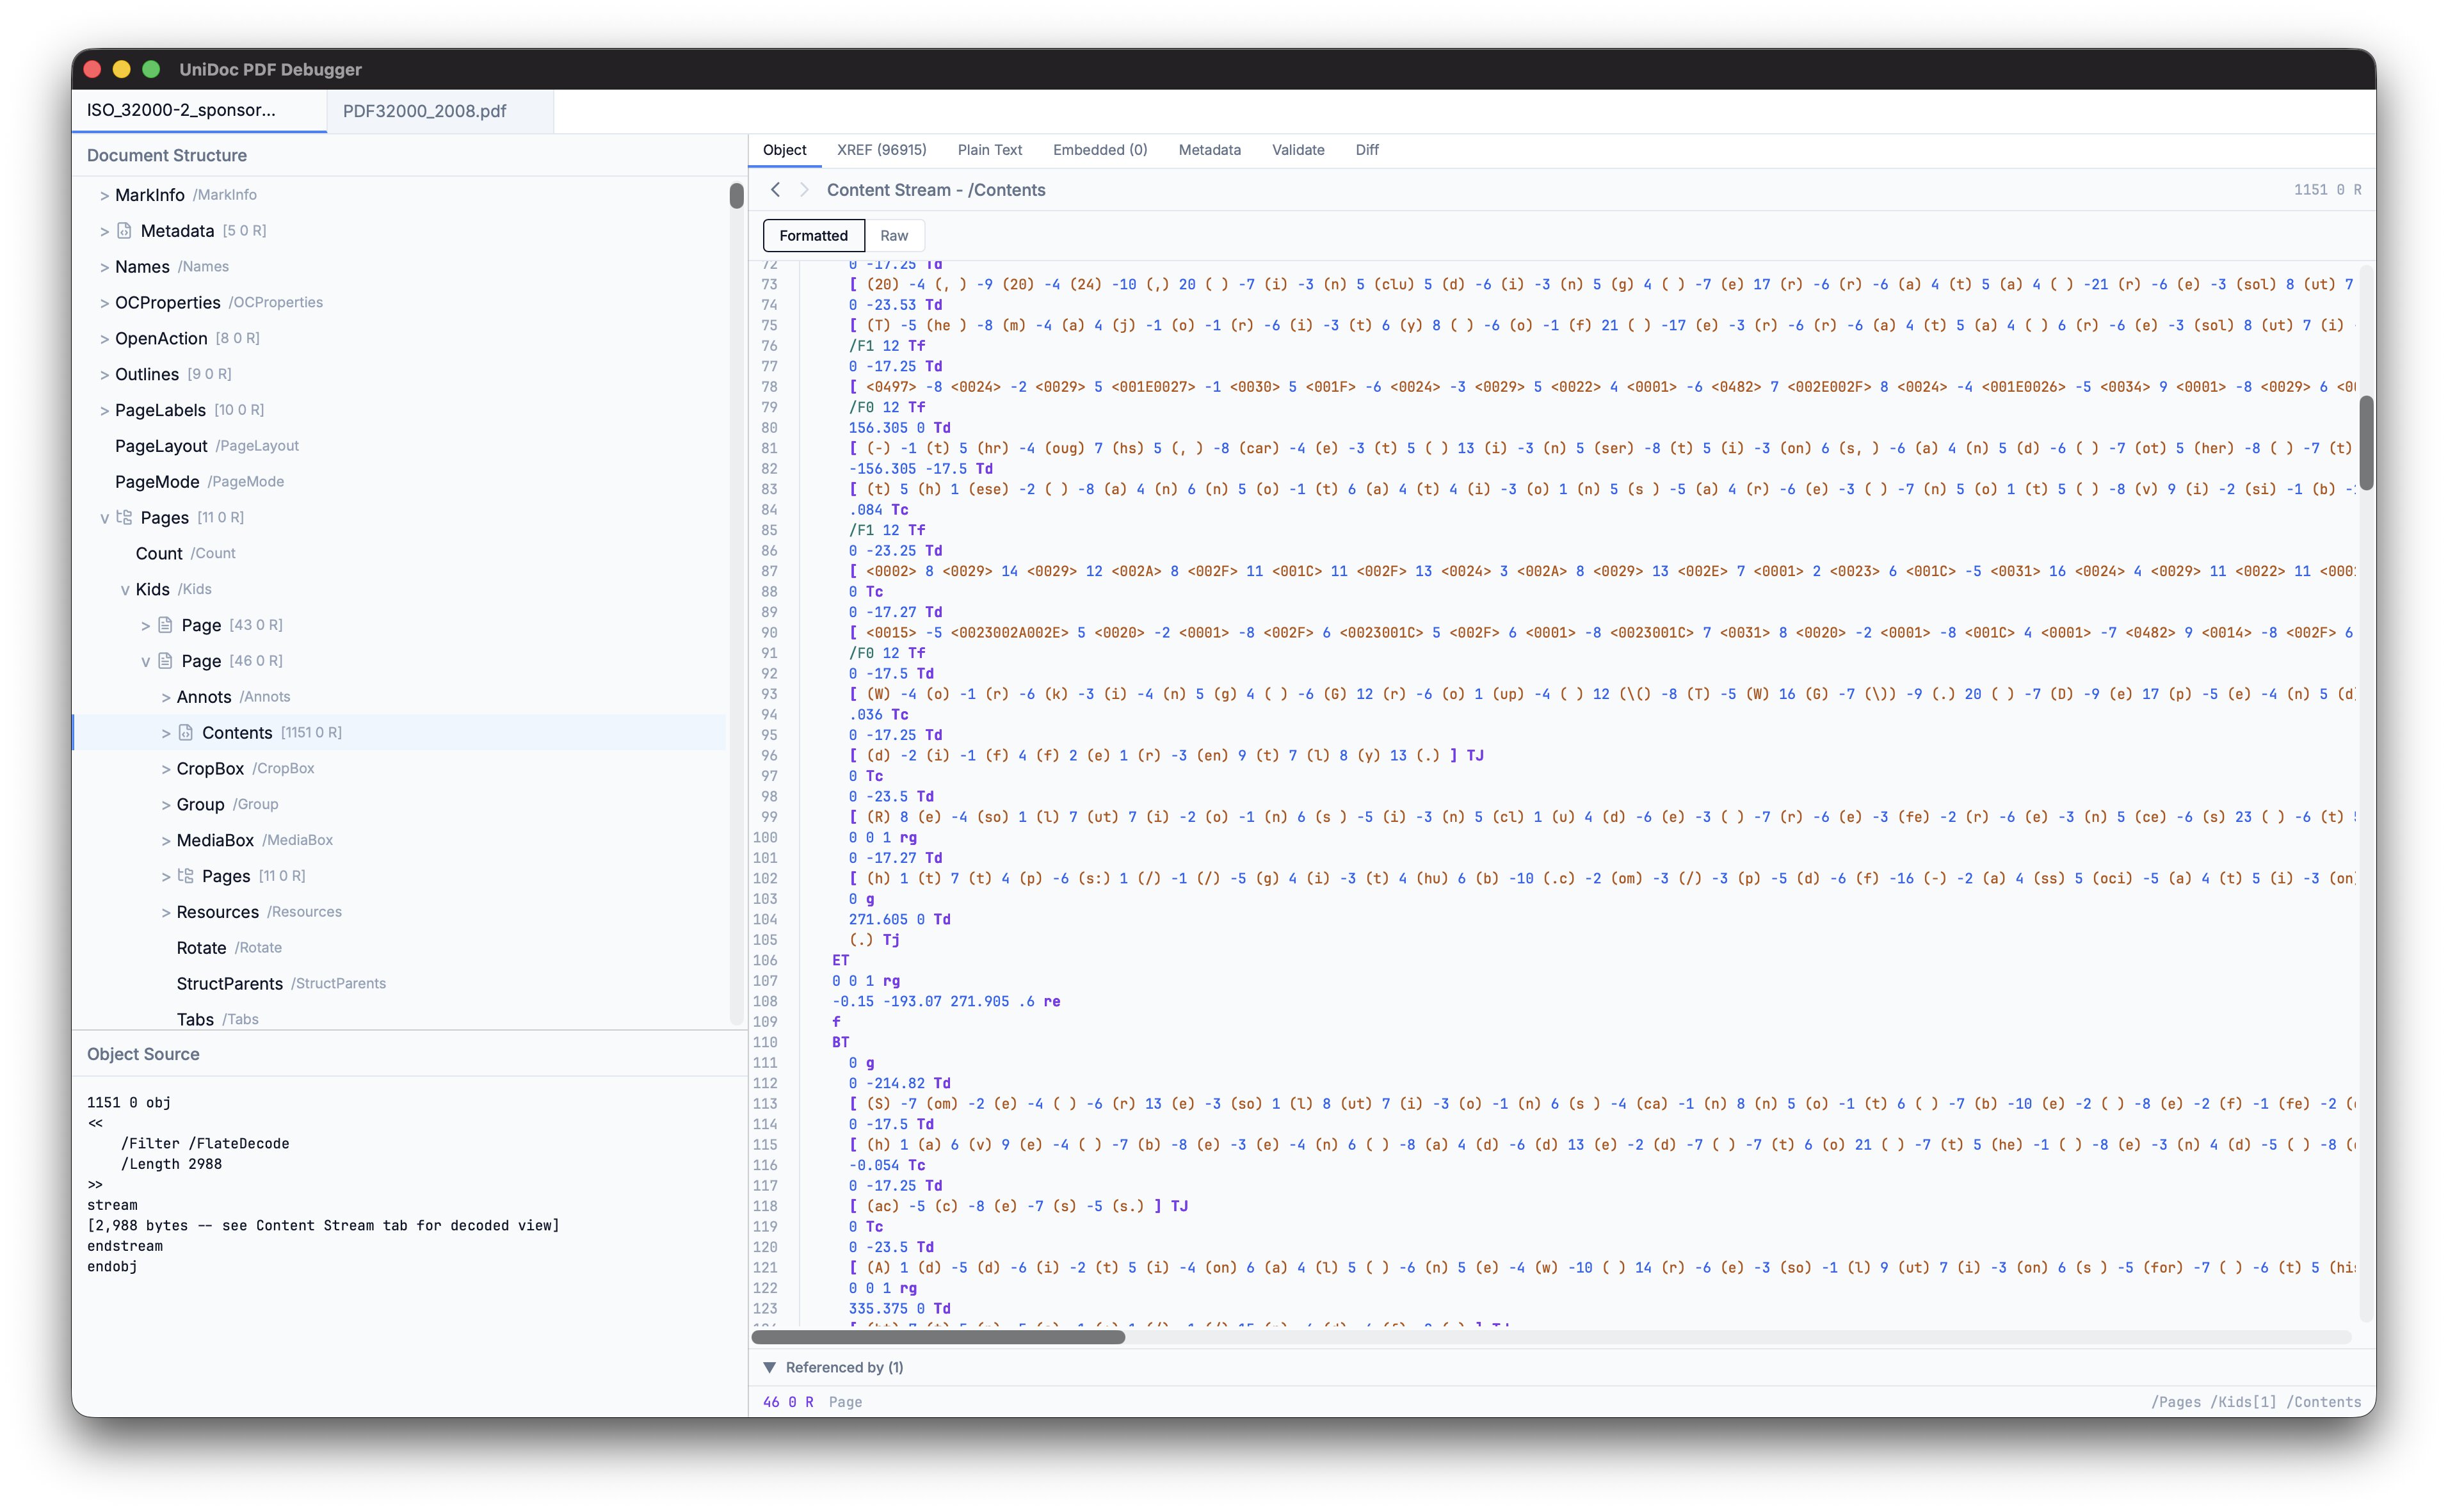
In the app, you open a file (File > Open, or just drag it onto the window) and the tree shows up on the left. Click a page’s content stream and the decoded operators appear on the right; click an image and you see the actual pixels. That’s most of a debugging session right there.
The CLI covers the same ground from the terminal. By default it prints plain text you can read; add --json when you want something a script can parse:
# Walk the object tree three levels deep
pdfdebug dump tree --depth 3 sample.pdf

# Inspect a single object by reference
pdfdebug dump object --ref "7 0 R" sample.pdf

# Decode the content stream of page 1
pdfdebug dump stream --page 1 sample.pdf

# Machine-readable output for a script or an agent
pdfdebug dump object --ref "7 0 R" --json sample.pdf

# Compare two files structurally
pdfdebug diff old.pdf new.pdf
Here’s what a few of those actually print. dump tree gives you the shape of the document at a glance:
Catalog Catalog
  Pages (2 0 R) Pages
    Count number
    Kids
    Type name
  Type name
Content streams come back decoded and laid out one operator group per line, so the drawing instructions read top to bottom instead of as a wall of bytes:
BT
  /F1 12 Tf
  100 700 Td
  (Hello World) Tj
ET
Run the same command with --json and you get the same content in a very different shape, built for a machine rather than an eye (trimmed here for space):
{
  "nodeId": "obj:0:4",
  "raw": "BT /F1 12 Tf 100 700 Td (Hello World) Tj ET",
  "tokenized": [
    {
      "type": "operator",
      "value": "BT",
      "line": 1,
      "col": 1
    },
    {
      "type": "name",
      "value": "/F1",
      "line": 1,
      "col": 4
    }
  ],
  "formatted": [ ... ],
  "error": ""
}
The plain-text form drops the operators onto neat lines so you can read them. The JSON form breaks the stream into individual tokens, each tagged with its type and its exact line and column, plus a formatted grouping and an error field for non-fatal decode problems. One is for skimming; the other is for a script that needs to know precisely what sits where. It’s the same information underneath, which is the point: whatever you learn by clicking, you can also get in a form your tooling can act on.
That last command in the list is worth calling out. diff walks both documents and reports how their structures differ, which is exactly what you want when you’re checking what your code changed between a before and an after, or when two files that should be identical somehow aren’t:
Structural diff: 2 added, 0 removed, 2 changed
Page count: 1 -> 3

~ /Root  keys: Pages
  ~ /Root/Pages  keys: Count, Kids
    ~ /Root/Pages/Count  1 -> 3
    ~ /Root/Pages/Kids
      + /Root/Pages/Kids[1]  << /MediaBox [...] /Parent <ref> /Type /Page >>
      + /Root/Pages/Kids[2]  << /MediaBox [...] /Parent <ref> /Type /Page >>
It returns distinct exit codes for identical, different, and errored, so it slots straight into a script or a test.
One more thing worth knowing: the --json output is the stable contract. The plain-text format is for reading and can change between releases, so anything you automate should go through --json. That’s what makes the debugger easy to drop into a CI check or an agent workflow rather than something only a human can drive.
We’re keeping this short on purpose. Actually reading a content stream, tracing a broken reference, or taking a signature apart is worth a post of its own, and we’ll get to those.
Who it’s for
We had three kinds of people in mind while building it, though it holds up whether PDFs are new to you or you’ve had the spec memorized for years.
If you build PDF software, SDKs, generators, converters, the debugger is your ground truth. When the output looks off, you need to see the objects your code actually wrote, not the ones you meant to write, and this shows you exactly that.
If you do forensics or security work, everything here is read-only and nothing in the file is ever executed. You can pull a suspicious document apart, follow its references, and look at embedded payloads without any risk of setting something off.
And if you work on compliance, having the structural checks and raw object access side by side means you can find why a file fails a profile and drill down to the specific object that caused it.
For anyone still getting comfortable with PDF internals, clicking through a real document is a good way to make the abstract idea of an “object graph” concrete. For everyone else, it just saves you from decoding xref tables and content streams by hand.
Why we built it
The honest answer is that we wanted a particular kind of tool and couldn’t quite find it.
There’s already good work in this space. A handful of tools will load a document read-only and let you walk its structure, and some have done that well for years. What we kept reaching for was something with a slightly different shape: a modern app that feels native across macOS, Windows, and Linux, paired with a CLI that runs on the same engine. So the inspection you do by clicking is the same inspection you can script or drop into CI, and it’s all backed by the same view of the file.
That combination, GUI and CLI over one shared core, with content-stream decoding and compliance-oriented checks built in, is what we set out to build.
It’s Apache 2.0 licensed and open source, and it’s a community-driven companion to UniDoc’s commercial PDF toolkit. The core PDF logic sits in a clean package, free of GUI dependencies, that the GUI, the CLI, and the tests all share, which is what keeps the behavior the same no matter how you get at it.
Try it
Pre-built binaries for macOS (Apple Silicon), Windows (x64), and Linux (x64) are on the GitHub Releases page, or you can build from source at github.com/unidoc/pdfdebug. The current builds are unsigned, so macOS and Windows may warn on first launch. Grab it, open a PDF that’s been giving you trouble, and have a look at what’s really inside.
See unidoc.io for UniDoc’s commercial PDF solutions.